OpenTelemetry
OpenTelemetry (OTel) is a collection of tools, APIs, and SDKs for generating and collecting telemetry data (metrics, logs, and traces). This is very useful for analyzing software performance and behavior, especially in highly distributed systems.
OpenTelemetry Signals
Section titled “OpenTelemetry Signals”OpenTelemetry signals are the information collected and processed to describe the internal activity of the system. The most common signals are traces, metrics, and logs.
.NET 8+ comes with first class support for OpenTelemetry. IdentityServer emits traces, metrics, and logs you can collect.
Metrics
Section titled “Metrics”Metrics are high level statistic counters. They provide an aggregated overview and can be used to set monitoring rules.
Traces
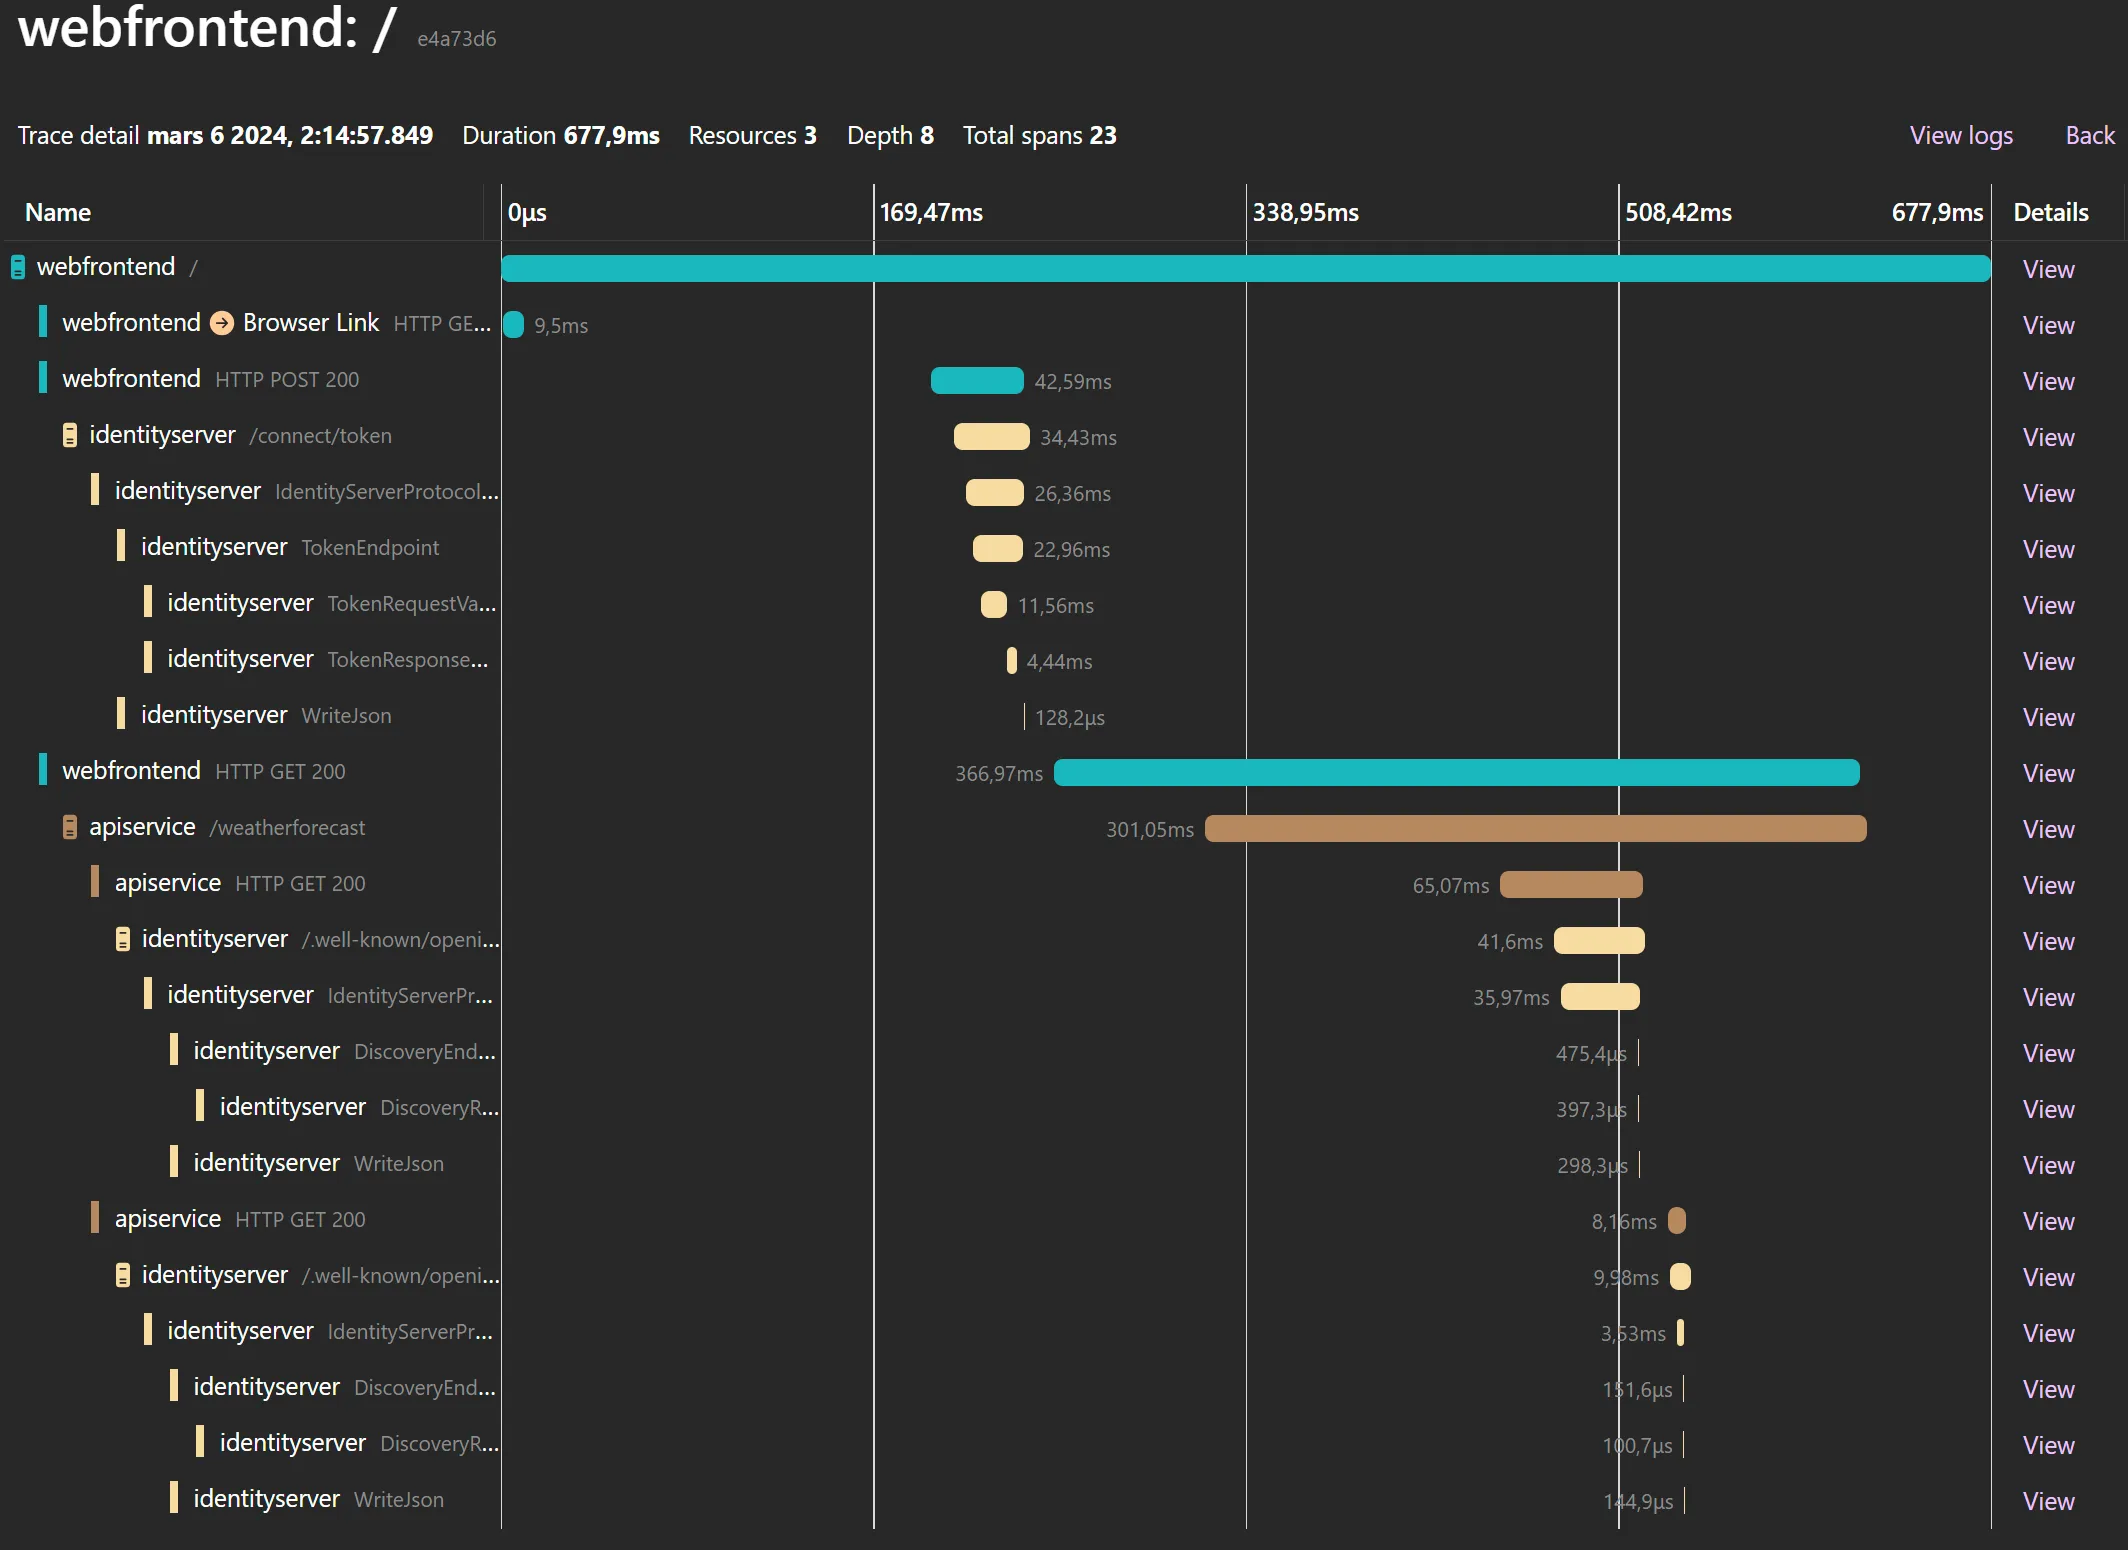
Section titled “Traces”Traces shows individual requests and dependencies. The output is very useful for visualizing the control flow and finding performance bottlenecks.
This is an example of distributed traces from a web application calling an API (displayed using our
Aspire sample). The web application uses a refresh token to call
IdentityServer to get a new access token and then calls the API. The API reads the discovery endpoint, finds the jwks
url and then gets the keys from jwks endpoint.
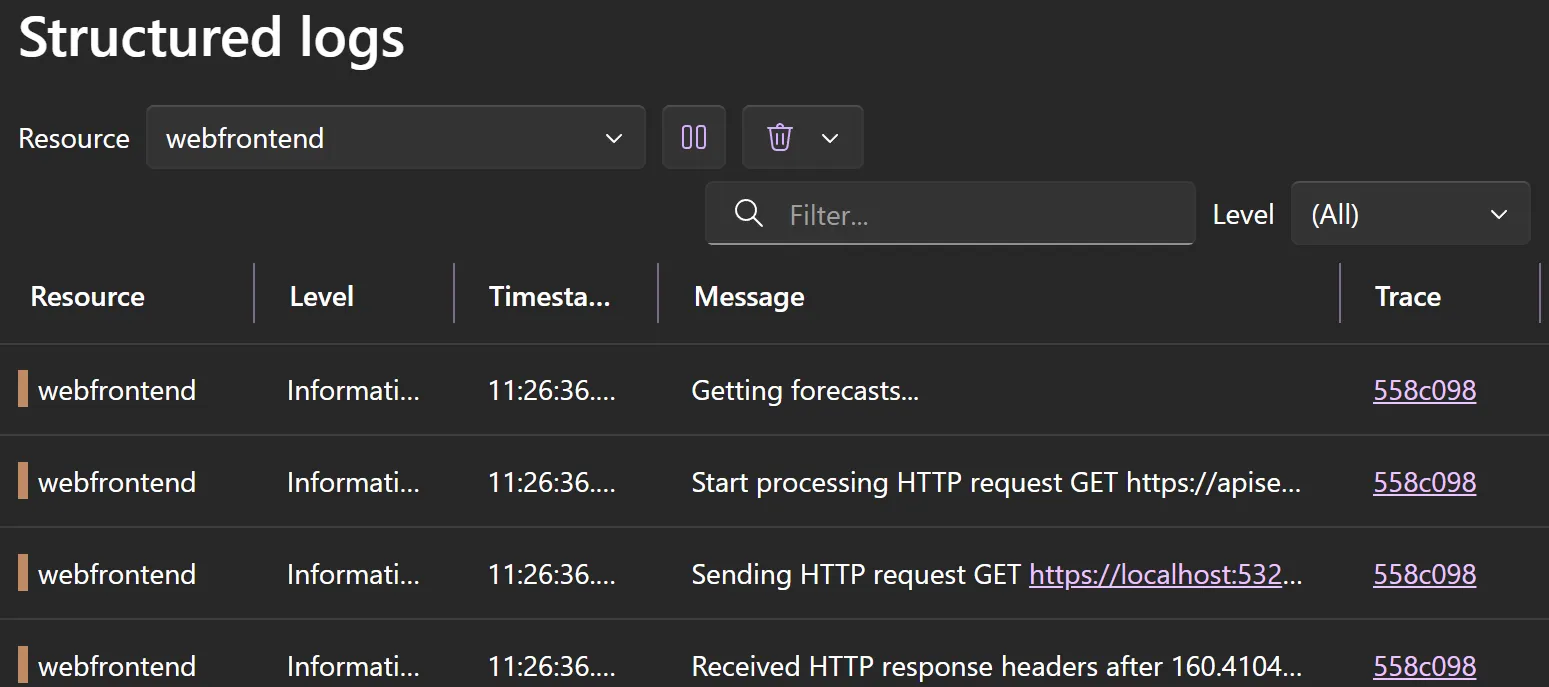
OpenTelemetry in .NET 8+ can export logs written to the standard ILogger system. The logs are augmented with
trace ids and correlated with traces.
This is an example of a structured log message from a web application calling an API (also displayed using our Aspire sample).
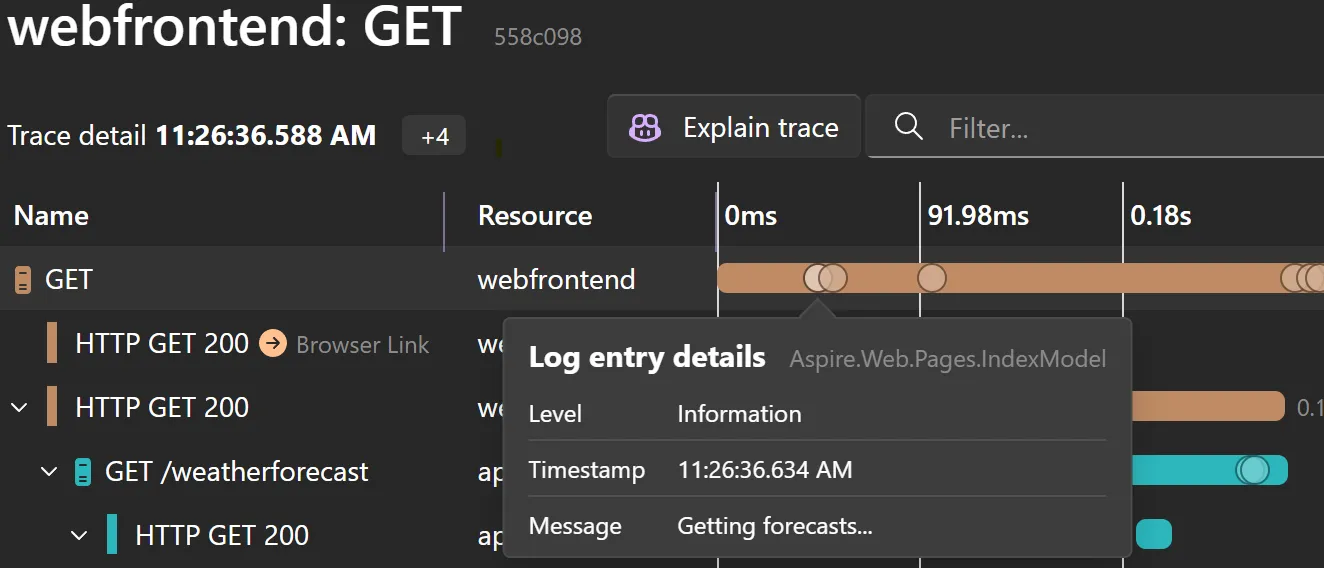
Here is an example of that same log message appearing in the trace. Aspire displays the log entry details as dots on the trace timeline.
To start emitting OpenTelemetry tracing and metrics information you need to:
- add the OpenTelemetry libraries to your IdentityServer and client applications
- start collecting traces and metrics from the various IdentityServer sources (and other sources e.g. ASP.NET Core)
- add the OpenTelemetry configuration to your service setup
For development a simple option is to export the tracing information to the console and use the Prometheus
exporter to create a human-readable /metrics endpoint for the metrics.
dotnet add package OpenTelemetrydotnet add package OpenTelemetry.Extensions.Hostingdotnet add package OpenTelemetry.Instrumentation.AspNetCoredotnet add package OpenTelemetry.Exporter.OpenTelemetryProtocolusing OpenTelemetry.Resources;
// Add OpenTelemetry logging infrastructure// to correlate logs with tracesbuilder.Logging.AddOpenTelemetry();
// Enable OpenTelemetryvar openTelemetry = builder.Services.AddOpenTelemetry();
openTelemetry.ConfigureResource(r => r .AddService(builder.Environment.ApplicationName));
openTelemetry.WithMetrics(m => m .AddMeter(Telemetry.ServiceName) .AddMeter(Pages.Telemetry.ServiceName) .AddPrometheusExporter());
openTelemetry.WithTracing(t => t .AddSource(IdentityServerConstants.Tracing.Basic) .AddSource(IdentityServerConstants.Tracing.Cache) .AddSource(IdentityServerConstants.Tracing.Services) .AddSource(IdentityServerConstants.Tracing.Stores) .AddSource(IdentityServerConstants.Tracing.Validation) .AddAspNetCoreInstrumentation() .AddConsoleExporter());Add the Prometheus exporter to the pipeline
// Map /metrics that displays OpenTelemetry data in human-readable form.app.UseOpenTelemetryPrometheusScrapingEndpoint();This setup will write the tracing information to the console and provide metrics on the /metrics endpoint.
Metrics
Section titled “Metrics”OpenTelemetry metrics are run-time measurements that are intended to provide an indication of overall health and are typically used to show graphs on a dashboard or to set up monitoring rules. When that monitoring reveals issues, traces and logs are used to investigate further. OpenTelemetry monitoring tools often provide features to find the traces and logs corresponding to certain metrics.
IdentityServer emits metrics from the IdentityServer middleware and services. Our quick start for the UI also contains metrics that can be used as a starting point for monitoring UI events. The metric counters that IdentityServer emits are designed to not contain any sensitive information. They are often tagged to indicate the source of the events.
High level Metrics
Section titled “High level Metrics”These metrics are instrumented by the IdentityServer middleware and services and are
intended to describe the overall usage and health of the system. They could provide the
starting point for building a metrics dashboard. The high level metrics are created by the
meter named “Duende.IdentityServer”, which is the value of the
Duende.IdentityServer.Telemetry.ServiceName constant.
Telemetry.Metrics.Counters.Operation
Section titled “Telemetry.Metrics.Counters.Operation”Counter name: tokenservice.operation
Aggregated counter of failed and successful operations. The result tag indicates if an operation succeeded, failed, or caused an internal error. It is expected to have some failures during normal operations. In contrast, operations tagged with a result of internal_error are abnormal and indicate an unhandled exception. The error/success ratio can be used as a very high level health metric.
| Tag | Description |
|---|---|
| error | Error label on errors |
| result | Success, error or internal_error |
| client | Id of client requesting the operation. May be empty. |
Telemetry.Metrics.Counters.ActiveRequests
Section titled “Telemetry.Metrics.Counters.ActiveRequests”Counter name: active_requests
Gauge/up-down counter that shows current active requests that are processed by any IdentityServer endpoint. Note that the pages in the user interface are not IdentityServer endpoints and are not included in this count.
| Tag | Description |
|---|---|
| endpoint | The type name for the endpoint processor |
| path | The path of the request |
Detailed Metrics
Section titled “Detailed Metrics”These detailed metrics are instrumented by the IdentityServer middleware and services and track usage of specific flows and features.
Telemetry.Metrics.Counters.ApiSecretValidation
Section titled “Telemetry.Metrics.Counters.ApiSecretValidation”Counter name: tokenservice.api.secret_validation
Number of successful/failed validations of API Secrets.
| Tag | Description |
|---|---|
| api | The Api Id |
| auth_method | Authentication method used |
| error | Error label on errors |
Telemetry.Metrics.Counters.BackchannelAuthentication
Section titled “Telemetry.Metrics.Counters.BackchannelAuthentication”Counter name: tokenservice.backchannel_authentication
Number of successful/failed back channel authentications (CIBA).
| Tag | Description |
|---|---|
| client | The client Id |
| error | Error label on errors |
Telemetry.Metrics.Counters.ClientConfigValidation
Section titled “Telemetry.Metrics.Counters.ClientConfigValidation”Counter name: tokenservice.client.config_validation
Number of successful/failed client validations.
| Tag | Description |
|---|---|
| client | The client Id |
| error | Error label on errors |
Telemetry.Metrics.Counters.ClientSecretValidation
Section titled “Telemetry.Metrics.Counters.ClientSecretValidation”Counter name: tokenservice.client.secret_validation
Number of successful/failed client secret validations.
| Tag | Description |
|---|---|
| client | The client Id |
| auth_method | The authentication method on success |
| error | Error label on errors |
Telemetry.Metrics.Counters.DeviceAuthentication
Section titled “Telemetry.Metrics.Counters.DeviceAuthentication”Counter name: tokenservice.device_authentication
Number of successful/failed device authentications.
| Tag | Description |
|---|---|
| client | The client Id |
| error | Error label on errors |
Telemetry.Metrics.Counters.DynamicIdentityProviderValidation
Section titled “Telemetry.Metrics.Counters.DynamicIdentityProviderValidation”Counter name: tokenservice.dynamic_identityprovider.validation
Number of successful/failed validations of dynamic identity providers.
| Tag | Description |
|---|---|
| scheme | The scheme name of the provider |
| error | Error label on errors |
Telemetry.Metrics.Counters.Introspection
Section titled “Telemetry.Metrics.Counters.Introspection”Counter name: tokenservice.introspection
Number of successful/failed token introspections.
| Tag | Description |
|---|---|
| caller | The caller of the endpoint, a client id or api id. |
| active | Was the token active? Only sent on success |
| error | Error label on errors |
Telemetry.Metrics.Counters.PushedAuthorizationRequest
Section titled “Telemetry.Metrics.Counters.PushedAuthorizationRequest”Counter name: tokenservice.pushed_authorization_request
Number of successful/failed pushed authorization requests.
| Tag | Description |
|---|---|
| client | The client Id |
| error | Error label on errors |
Telemetry.Metrics.Counters.ResourceOwnerAuthentication
Section titled “Telemetry.Metrics.Counters.ResourceOwnerAuthentication”Counter name: tokenservice.resourceowner_authentication
Number of successful/failed resource owner authentications.
| Tag | Description |
|---|---|
| client | The client Id |
| error | Error label on errors |
Telemetry.Metrics.Counters.Revocation
Section titled “Telemetry.Metrics.Counters.Revocation”Counter name: tokenservice.revocation
Number of successful/failed token revocations.
| Tag | Description |
|---|---|
| client | The client Id |
| error | Error label on errors |
Telemetry.Metrics.Counters.TokenIssued
Section titled “Telemetry.Metrics.Counters.TokenIssued”Counter name: tokenservice.token_issued
Number of successful/failed token issuance attempts. Note that a token issuance might include multiple actual tokens (id_token, access token, refresh token).
| Tag | Description |
|---|---|
| client | The client Id |
| grant_type | The grant type used |
| authorize_request_type | The authorize request type, if information about it is available |
| error | Error label on errors |
Metrics In The UI
Section titled “Metrics In The UI”The UI in your IdentityServer host can instrument these events to measure activities that occur during interactive flows, such as user login and logout. These events are not instrumented by the IdentityServer middleware or services because they are the responsibility of the UI. Our templated UI does instrument these events, and you can alter and add metrics as needed to the UI in your context.
Telemetry.Metrics.Counters.Consent
Section titled “Telemetry.Metrics.Counters.Consent”Counter name: tokenservice.consent
Consent requests granted or denied. The counters are per scope, so if a user consents to multiple scopes, the counter is increased multiple times, one for each scope. This allows the scope name to be included as a tag without causing an explosion of combination of tags.
| Tag | Description |
|---|---|
| client | The client Id |
| scope | The scope names |
| consent | granted or denied |
Telemetry.Metrics.Counters.GrantsRevoked
Section titled “Telemetry.Metrics.Counters.GrantsRevoked”Counter name: tokenservice.grants_revoked
Revocation of grants.
| Tag | Description |
|---|---|
| client | The client Id, if grants are revoked only for one client. If not set, the revocation was for all clients. |
Telemetry.Metrics.Counters.UserLogin
Section titled “Telemetry.Metrics.Counters.UserLogin”Counter names: tokenservice.user_login
Successful and failed user logins.
| Tag | Description |
|---|---|
| client | The client Id, if the login was caused by a request from a client |
| idp | The idp (ASP.NET Core Scheme name) used to log in |
| error | Error label on errors |
Telemetry.Metrics.Counters.UserLogout
Section titled “Telemetry.Metrics.Counters.UserLogout”Counter name: user_logout
User logout. Note that this is only raised on explicit user logout, not if the session times out. The number of logouts will typically be lower than the number of logins.
| Tag | Description |
|---|---|
| idp | The idp (ASP.NET scheme name) logging out from |
.NET Authentication And Authorization Metrics
Section titled “.NET Authentication And Authorization Metrics”Starting with .NET 10, metrics are available for certain authentication and authorization events in ASP.NET Core. You can get metrics for the following events:
- Authentication
- Authenticated request duration (
aspnetcore.authentication.authenticate.duration) - Challenge count (
aspnetcore.authentication.challenges) - Forbid count (
aspnetcore.authentication.forbids) - Sign in count (
aspnetcore.authentication.sign_ins) - Sign out count (
aspnetcore.authentication.sign_outs)
- Authenticated request duration (
- Authorization
- Count of requests requiring authorization (
aspnetcore.authorization.attempts)
- Count of requests requiring authorization (
Refer to the ASP.NET Core documentation for more information about ASP.NET Core built-in metrics.
ASP.NET Core Identity metrics
Section titled “ASP.NET Core Identity metrics”When using ASP.NET Identity, metrics are available for key user and sign-in operation metrics. These let you monitor user management activities like creating users, changing passwords, etc. It’s also possible to track login attempts, sign-ins, sign-outs, and two-factor authentication usage.
The Microsoft.AspNetCore.Identity meter provides the following metrics:
- User management metrics
- Duration of user creation operations (
aspnetcore.identity.user.create.duration) - Duration of user update operations (
aspnetcore.identity.user.update.duration) - Duration of user deletion operations (
aspnetcore.identity.user.delete.duration) - Number of password verification attempts (
aspnetcore.identity.user.check_password_attempts) - Number of tokens generated for users, such as password reset tokens (
aspnetcore.identity.user.generated_tokens) - Number of token verification attempts (
aspnetcore.identity.user.verify_token_attempts)
- Duration of user creation operations (
- Authentication metrics
- Duration of authentication operations (
aspnetcore.identity.sign_in.authenticate.duration) - Number of password check attempts at sign-in (
aspnetcore.identity.sign_in.check_password_attempts) - Number of successful sign-ins (
aspnetcore.identity.sign_in.sign_ins) - Number of sign-outs (
aspnetcore.identity.sign_in.sign_outs) - Number of remembered two-factor authentication (2FA) clients (
aspnetcore.identity.sign_in.two_factor_clients_remembered) - Number of forgotten two-factor authentication (2FA) clients (
aspnetcore.identity.sign_in.two_factor_clients_forgotten)
- Duration of authentication operations (
Traces
Section titled “Traces”Here’s e.g. the output for a request to the discovery endpoint:
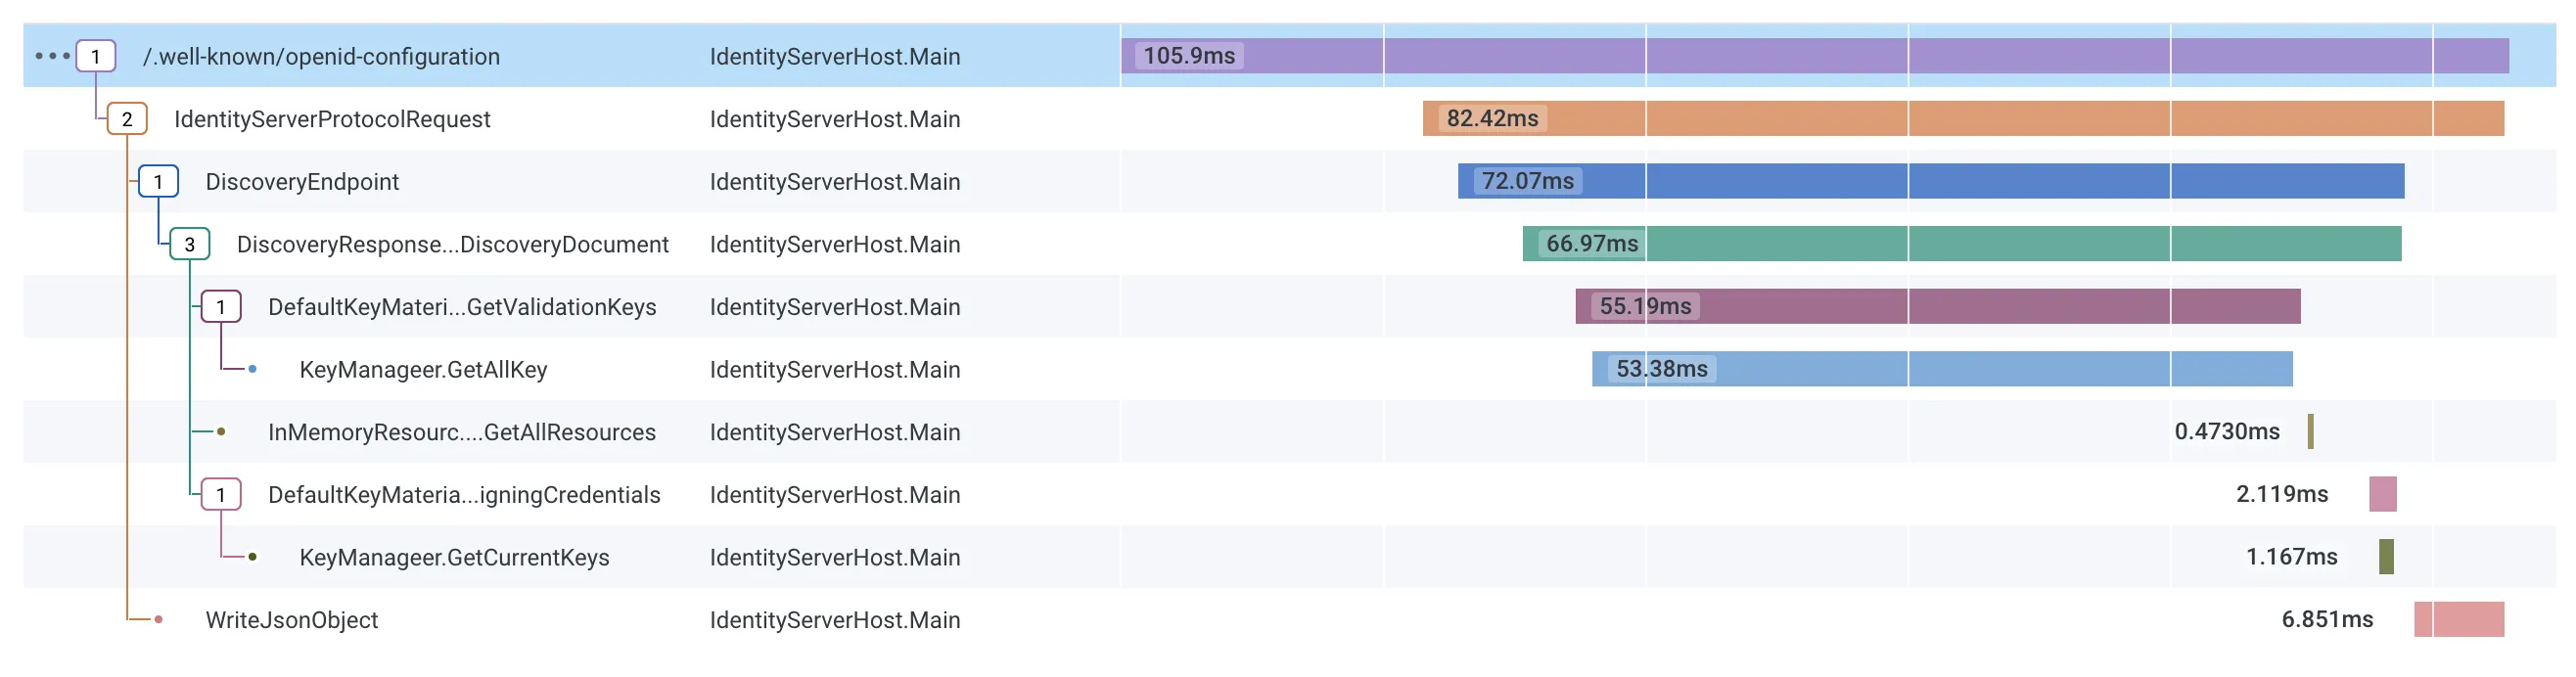
When multiple applications send their traces to the same OpenTelemetry server, this becomes super useful for following e.g. authentication flows over service boundaries.
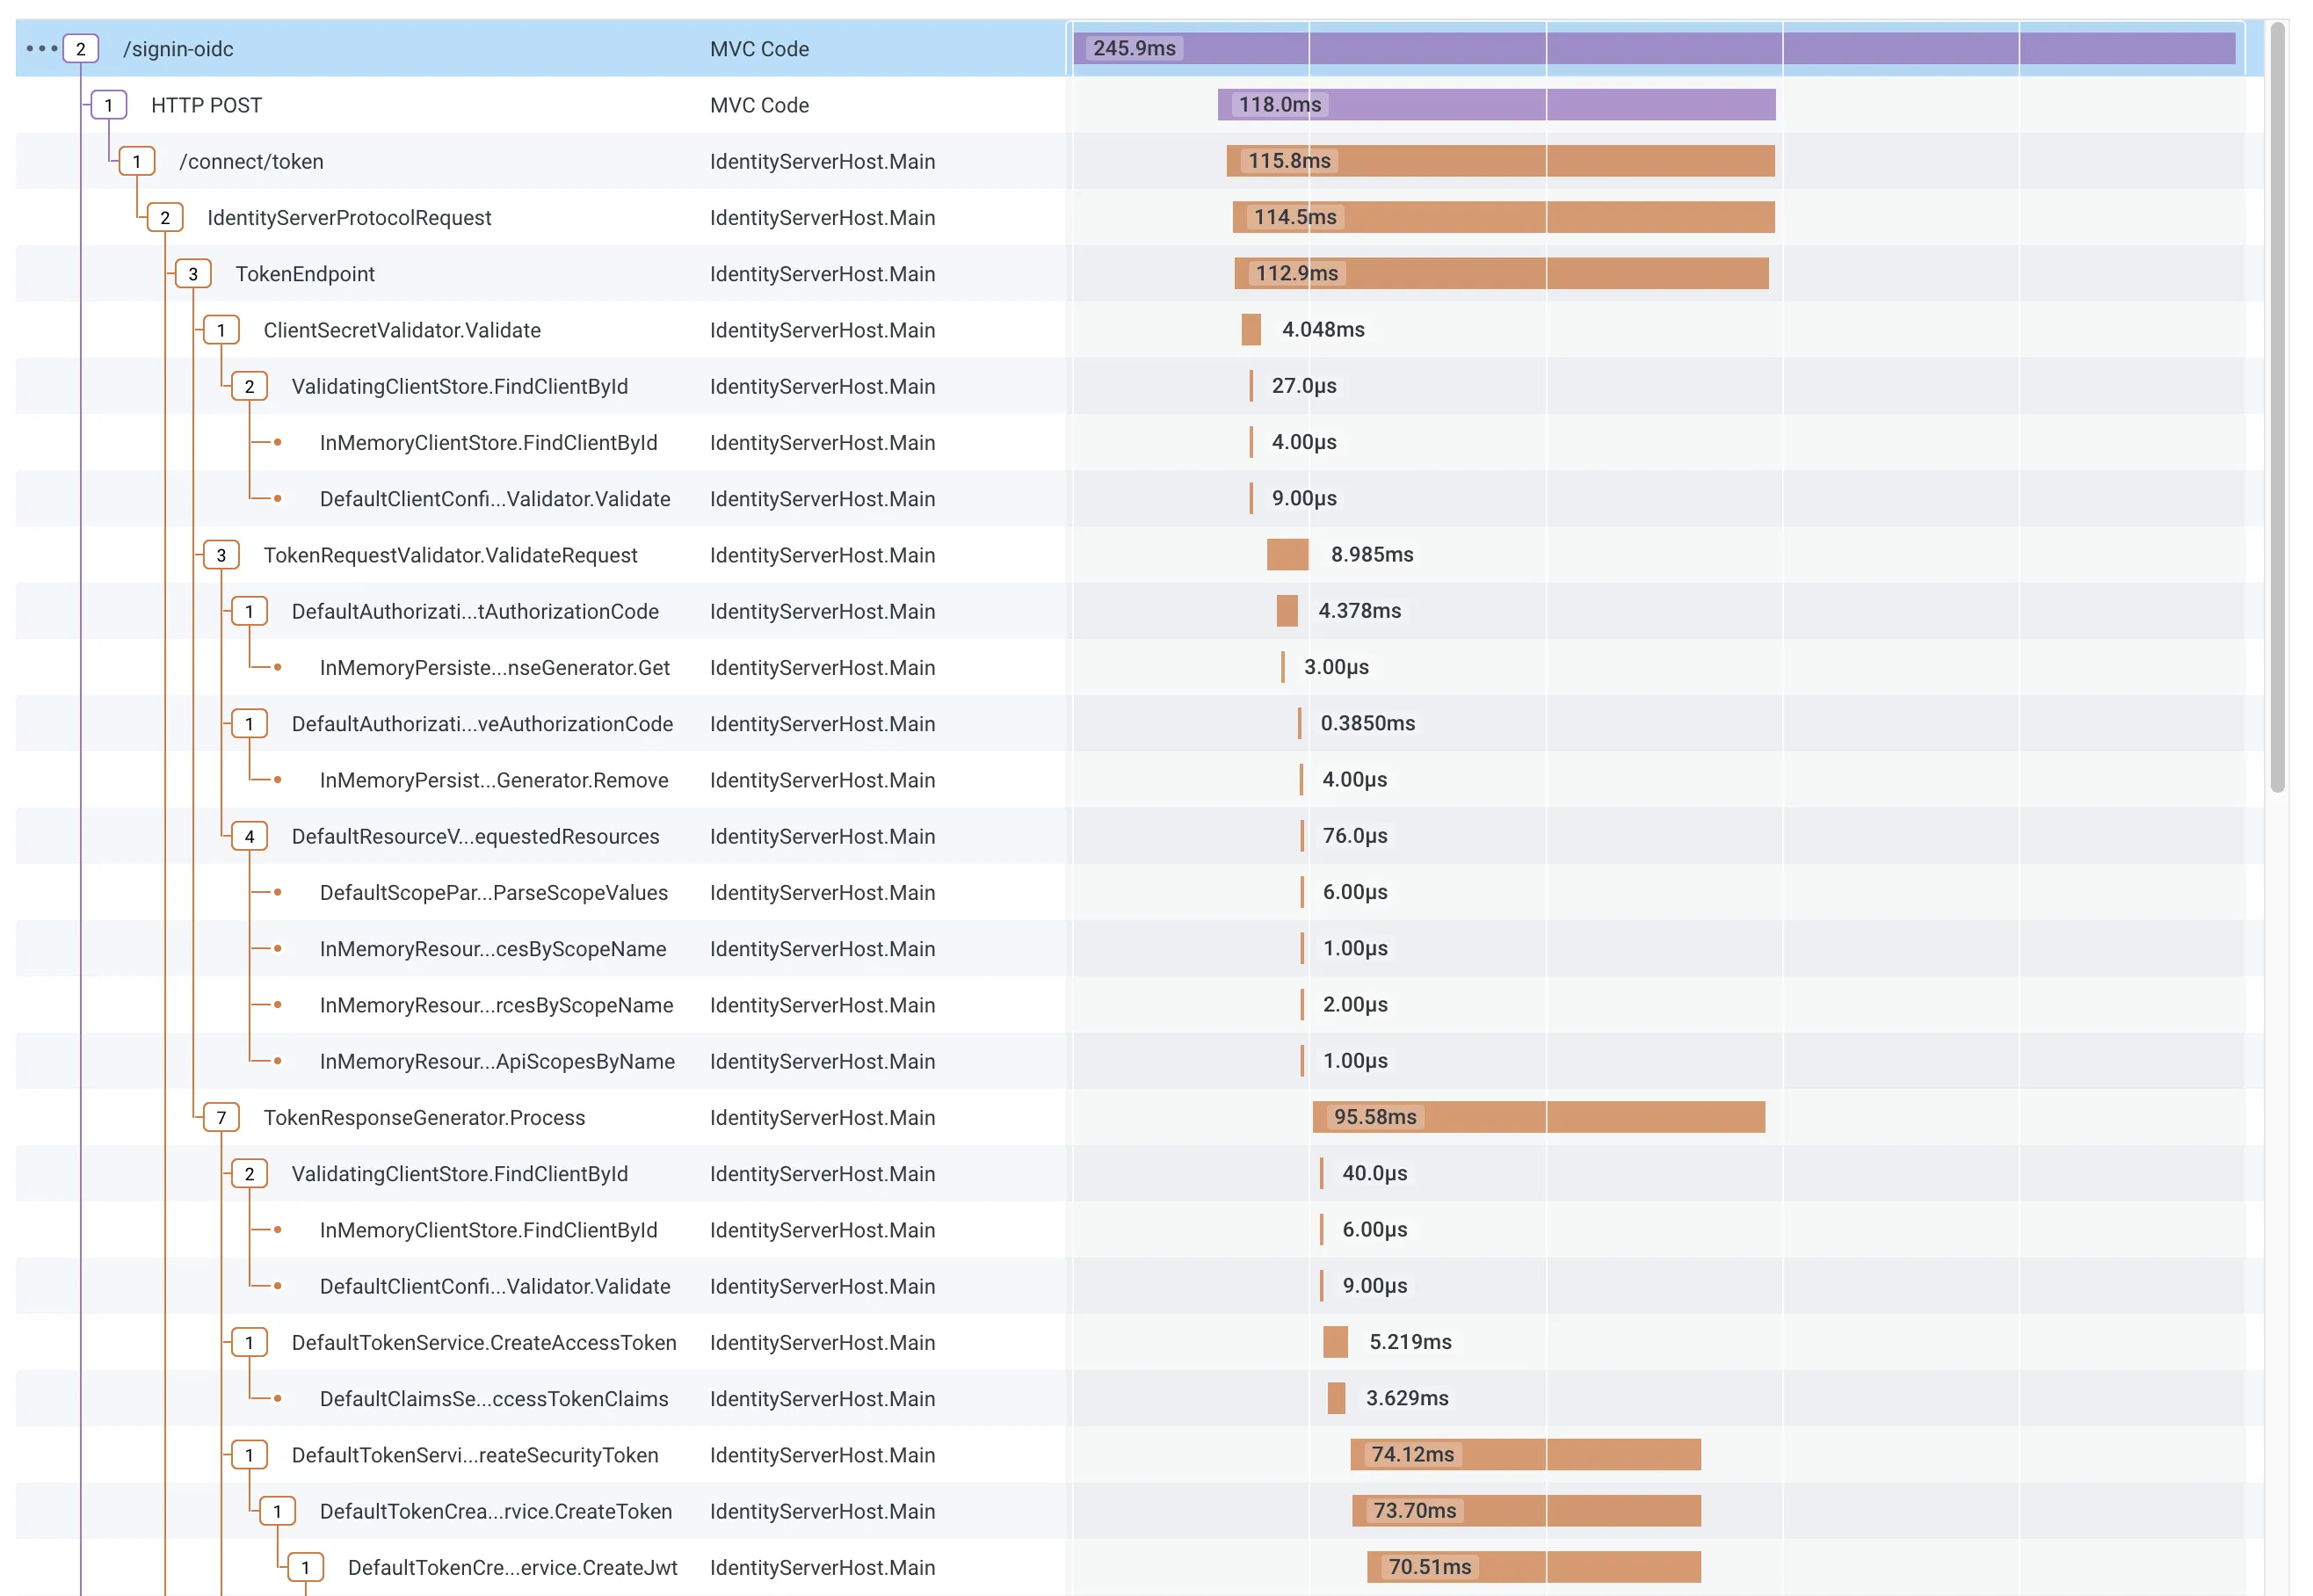
The following screenshot shows the ASP.NET Core OpenID Connect authentication handler redeeming the authorization code:
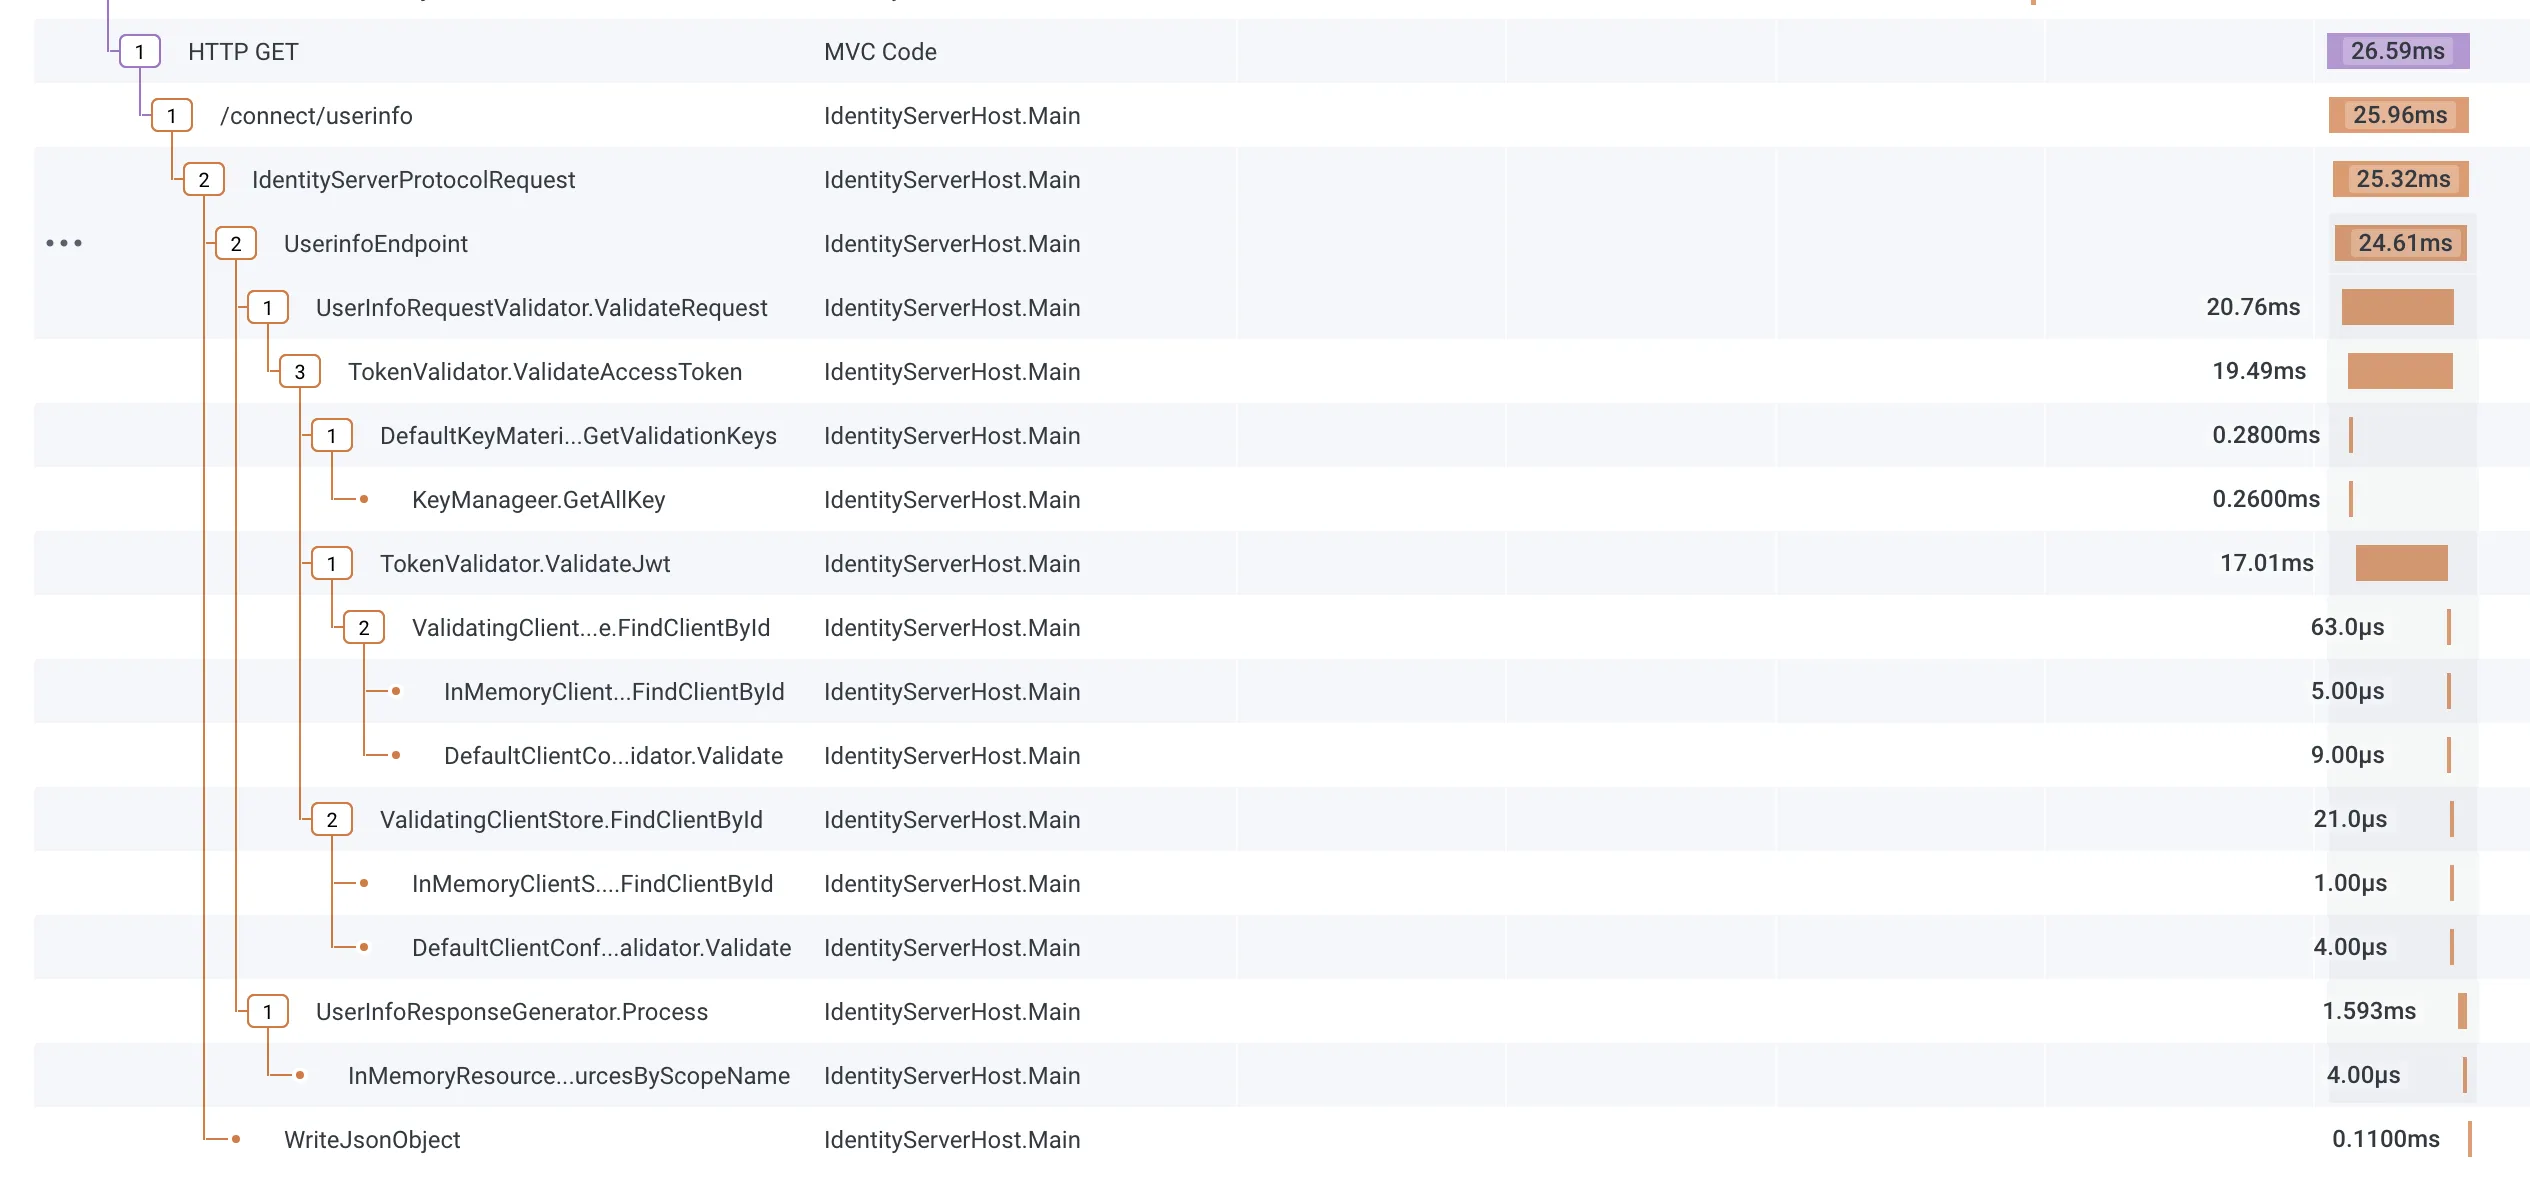
…and then contacting the userinfo endpoint:
The above screenshots are from https://www.honeycomb.io.
Tracing Sources
Section titled “Tracing Sources”IdentityServer can emit very fine-grained traces which is useful for performance troubleshooting and general exploration of the control flow.
This might be too detailed in production.
You can select which information you are interested in by selectively listening to various traces:
-
IdentityServerConstants.Tracing.BasicHigh level request processing like request validators and response generators
-
IdentityServerConstants.Tracing.CacheCaching related tracing
-
IdentityServerConstants.Tracing.ServicesServices related tracing
-
IdentityServerConstants.Tracing.StoresStore related tracing
-
IdentityServerConstants.Tracing.ValidationMore detailed tracing related to validation
OpenTelemetry From 3rd Party Logging Frameworks
Section titled “OpenTelemetry From 3rd Party Logging Frameworks”If you’re unable to use the ILogger system in .NET, your choice of logging framework may be able to push log messages to traces. You can view their documentation to set that up.
OpenTelemetry with Serilog
Section titled “OpenTelemetry with Serilog”If you are logging with Serilog and want to use that framework’s native API to push log messages to traces, you need to:
- Add the Serilog OpenTelemetry sink library
- Instruct the Serilog logger object to write to the OpenTelemetry sink
Note: See the Serilog OpenTelemetry sink documentation for the most up to date information.
dotnet add package Serilog.Sinks.OpenTelemetryLog.Logger = new LoggerConfiguration() .WriteTo.OpenTelemetry() .CreateLogger();